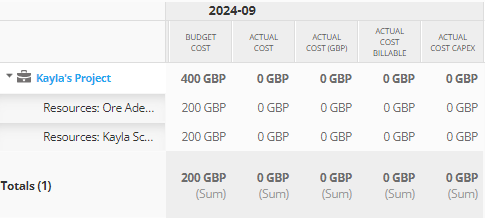
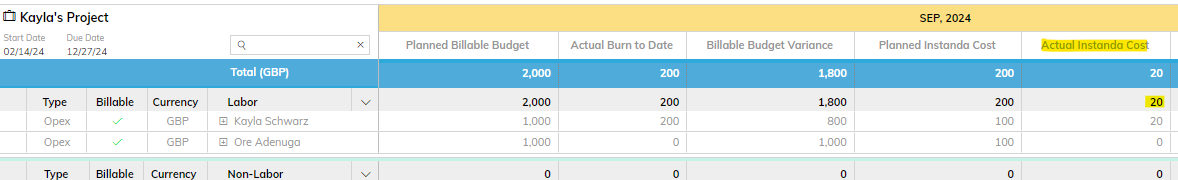
Hello Planview Community, curious to hear if anyone has knowledge in creating a report with a chart that looks identical to the Financial Planning view of a project (sample below), ideally a crosstab?

Thank you!!!

Hello Planview Community, curious to hear if anyone has knowledge in creating a report with a chart that looks identical to the Financial Planning view of a project (sample below), ideally a crosstab?
Thank you!!!
Already have an account? Login
No account yet? Create an account
Enter your E-mail address. We'll send you an e-mail with instructions to reset your password.