I’m trying to generate a report that would display the number of people in each User Group. I have been able to get a chart to display this information but am unable to produce a table with this information. Does anyone know how to display this in a table?
The parameters I have for the chart are as follows:
Report on: User
Include related data: Group
Chart Type: Standard
X-axis: User.Groups.Name
Y- axis: Display Number of People
Thanks for any advice!
Carey Petrie
Best answer by bkrutiy
Hello Carey,
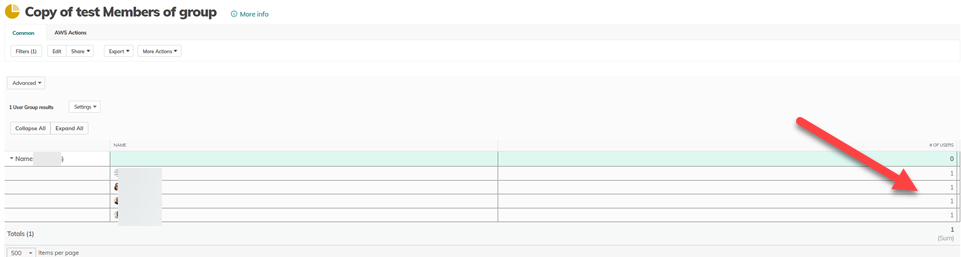
The report table does not provide the count OOTB. You need to customize it a bit and even then it does not seem to fully work. This may require a support ticket to see if there is a bug with doing a SUM on formula fields as it works on OOTB numeric fields. See image1 below. You can see that a report showing Groups/Users with a group by on Group.Name provides the Group (Grouped by), name of the members of the group and a formula field with a value 1 and configured to show Total = SUM. This shows the value 1 but is not rolling up the SUM to the group. This seems like a bug to me and should be reported.
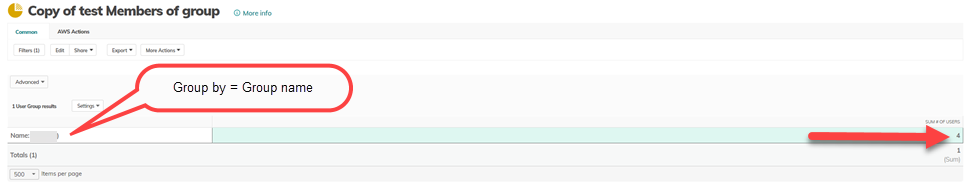
Other than the chart, you can show count as a Highlight as well. Within a table, the only way I was able to show a rollup SUM value by Group is to take the same report as mentioned before and show as Summary, see image2. The good news is that the SUM of the formula field shows # of Users correctly. The bad news is that Summary mode loses any other columns you may have like Member/User name. Hope this helps.
The report table does not provide the count OOTB. You need to customize it a bit and even then it does not seem to fully work. This may require a support ticket to see if there is a bug with doing a SUM on formula fields as it works on OOTB numeric fields. See image1 below. You can see that a report showing Groups/Users with a group by on Group.Name provides the Group (Grouped by), name of the members of the group and a formula field with a value 1 and configured to show Total = SUM. This shows the value 1 but is not rolling up the SUM to the group. This seems like a bug to me and should be reported.
Other than the chart, you can show count as a Highlight as well. Within a table, the only way I was able to show a rollup SUM value by Group is to take the same report as mentioned before and show as Summary, see image2. The good news is that the SUM of the formula field shows # of Users correctly. The bad news is that Summary mode loses any other columns you may have like Member/User name. Hope this helps.