

Using Copilot to Create Data Visualizations (No Programming Experience Required!)
Hey there! Ready to create some amazing data visualizations without writing a single line of code? You're in the right place! This guide will show you how to leverage Copilot to generate beautiful charts and tables, even if you've never programmed before. Trust me - if you can describe what you want, you can make it happen!
Getting Started: Your New Data Visualization Journey
You might not be able to code python, but Copilot can
Try typing:
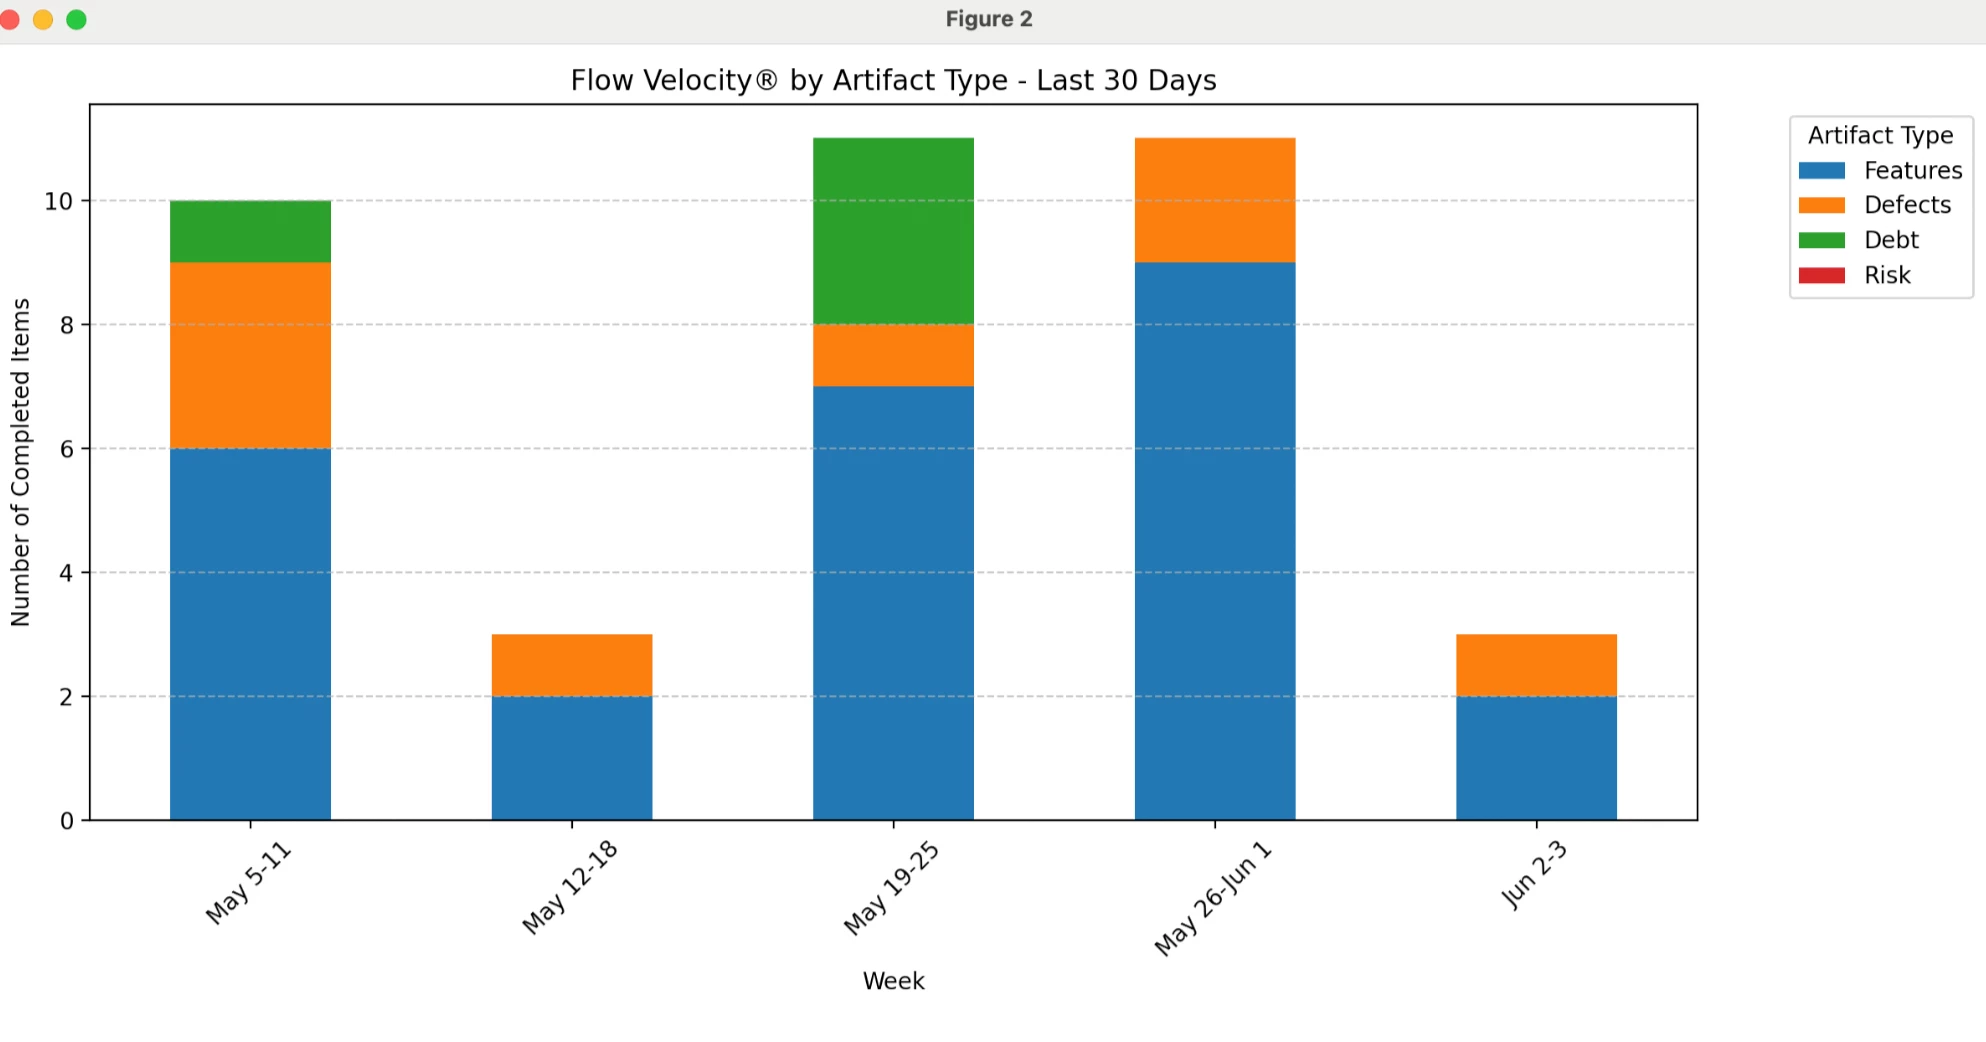
Create clean python code to create a bar chart showing Flow Velocity® by type (Features, Defects, Debt) over the last 30 days. Include proper labels and a title."
This will produce python code that when executed will draw a chart. Below is an “as is” example of what Copilot produced for me. Yours will be similar.
Note that the lines need to be removed before saving the file.
Eventually this will be built into Copilot, but this provides a way to do it.
import pandas as pd
import matplotlib.pyplot as plt


# Data from Flow Fabric™ (last 30 days)
weeks = ['Week 1', 'Week 2', 'Week 3', 'Week 4', 'Week 5']
features = [6, 2, 7, 9, 2]
defects = [3, 1, 1, 2, 1]
debt = [1, 0, 3, 0, 0]


# Create DataFrame
df = pd.DataFrame({
    'Features': features,
    'Defects': defects,
    'Debt': debt
}, index=weeks)


# Create stacked bar chart
ax = df.plot(kind='bar', stacked=True, figsize=(12, 6))


# Customize the chart
plt.title('Flow Velocity® by Type - Flow Fabric™', pad=20, fontsize=14, fontweight='bold')
plt.xlabel('Weeks', fontsize=12)
plt.ylabel('Number of Completed Items', fontsize=12)


# Customize colors
colors = ['#1f77b4', '#ff7f0e', '#2ca02c']  # Blue for Features, Orange for Defects, Green for Debt
for i, col in enumerate(df.columns):
    ax.patches[i*len(weeks):(i+1)*len(weeks)].set_facecolor(colors[i])


# Add legend
plt.legend(title='Flow Item Types', bbox_to_anchor=(1.05, 1), loc='upper left')


# Adjust layout to prevent label cutoff
plt.tight_layout()


# Show the plot
plt.show()
- Copy the file to a text editor and remove all lines that have if they are present.
- Save the File:
- Save the file with a .py extension (e.g.,
flow_metrics.py) - Make sure to save it as plain text, not rich text
- Save the file with a .py extension (e.g.,
- Run the Code:
- Open Command Prompt (Windows) or Terminal (Mac/Linux)
- Navigate to the directory where you saved the file
- Run the code using one of these commands:
orpython flow_metrics.pypython3 flow_metrics.py
Note: Make sure you have Python, pandas, and matplotlib installed on your system for the code to work properly. If you don’t you can ask Copilot for help.
3. **Run and Enjoy**: That's it! You've just created your first professional visualization!
## Making It Your Own
### Customization Made Simple
Want to change colors? Add more data? Make the chart bigger? Just tell Copilot what you want to modify. For example:
- "Please update the code to use blue for features, red for defects, and green for debt"
- "Make the chart title larger and bold"
- "Add a legend at the bottom of the chart"
### Beyond Bar Charts
Once you're comfortable, try creating:
- Line graphs for trend analysis
- Pie charts for distribution views
- Tables for detailed data review
- Stacked visualizations for comparing multiple metrics
Just remember to use those magic phrases when asking Copilot for help!
## Troubleshooting Tips (Because Everyone Needs Them!)
If something doesn't look quite right:
2. Ask Copilot to explain any part you're unsure about
3. Request modifications by being specific about what you want to change
## Next Steps
Once you've mastered the basics, you can:
- Experiment with different chart types
- Add interactive elements
- Create custom color schemes
- Combine multiple visualizations
Remember: You don't need to understand every line of code - that's what Copilot is for! Focus on describing what you want to see, and let Copilot handle the technical details.
## Final Thoughts
Creating data visualizations doesn't have to be complicated or require a computer science degree. With Copilot as your partner, you can create professional-quality charts and graphs that tell your data's story effectively. Start small, experiment freely, and most importantly - have fun with it!
Need help or have questions? Just ask! Copilot is here to help you every step of the way.