Hello community,
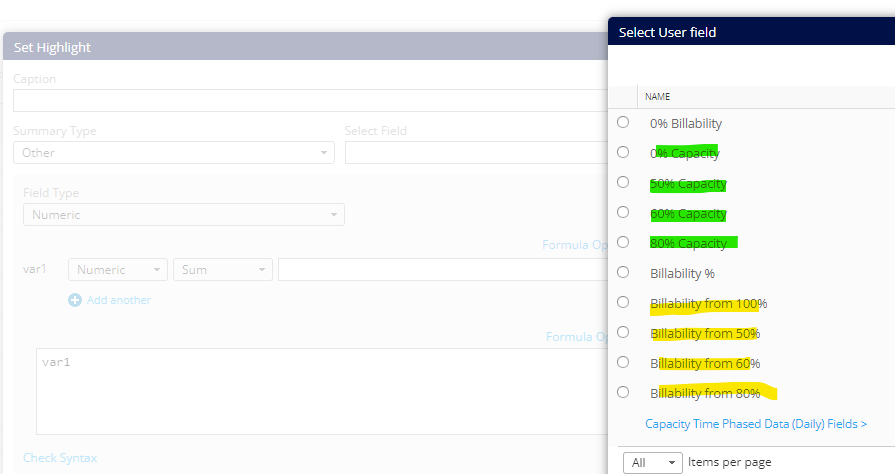
I’ve created a report with several calculated columns across multiple tabs for various capacity and billability metrics (i.e. 50% capacity calculation, 80% capacity calculation, screenshot below). Some of our resources have different billability targets hence “Billability from 100% capacity vs. Billability from 50% capacity” metrics. I’d like to have an overall summary tab with a Highlight showing all the totaled capacity and billability. So a highlight totaling all the Green highlighted below fields and Yellow highlighted below fields. Is there a way to do this so the highlight pulls all the capacity fields from each tab and totals?
Tabs:


