Solved

Multiple Calculated Fields for Highlights

  • April 10, 2024
  • 1 reply
  • 94 views

Forum|alt.badge.img+3

Hello community,


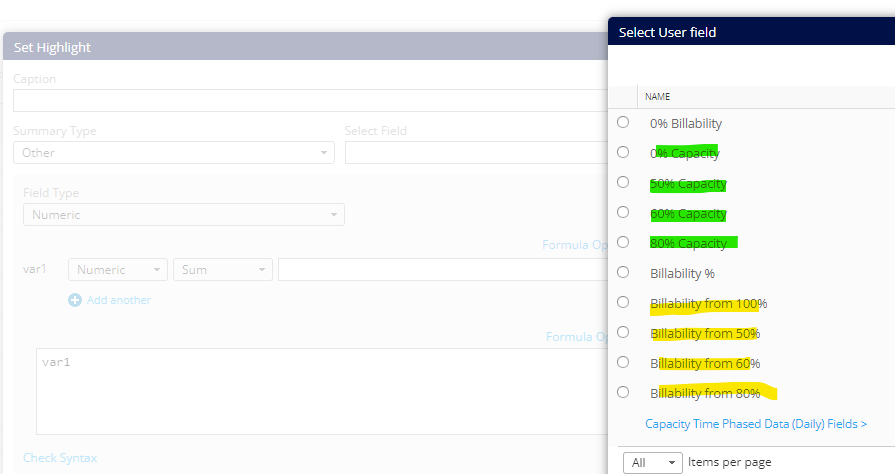
I’ve created a report with several calculated columns across multiple tabs for various capacity and billability metrics (i.e. 50% capacity calculation, 80% capacity calculation, screenshot below). Some of our resources have different billability targets hence “Billability from 100% capacity vs. Billability from 50% capacity” metrics.  I’d like to have an overall summary tab with a Highlight showing all the totaled capacity and billability. So a highlight totaling all the Green highlighted below fields and Yellow highlighted below fields. Is there a way to do this so the highlight pulls all the capacity fields from each tab and totals? 


Tabs:


Best answer by Limori

Hi Kayla

You would need to run the accumulated calculations and pull in all capacity data points (including formula fields) into that summary tab in order to show it in the highlight.

I hope that helps.

Limor

View original

Limori
Planview Falcons
Forum|alt.badge.img+4
  • Planview Falcons
  • April 14, 2024

Hi Kayla

You would need to run the accumulated calculations and pull in all capacity data points (including formula fields) into that summary tab in order to show it in the highlight.

I hope that helps.

Limor


Reply


Cookie policy

We use cookies to enhance and personalize your experience. If you accept you agree to our full cookie policy. Learn more about our cookies.

 
Cookie settings