In Portfolio and Resource Management, the "Actuals/Forecast" version is almost universally present. It consolidates both "Actual" data, typically sourced from timesheets, and "Forecast" data, often derived from resource requirements, reserves, and project allocations. This amalgamation offers a comprehensive overview of the project, encompassing expenditures incurred to date alongside estimated future expenses.
...
Data within each financial plan version is organized into monthly periods. Put simply, past months house actuals, while future months hold forecasts. The current month reflects actuals up to the latest financial load, transitioning to forecasts thereafter.
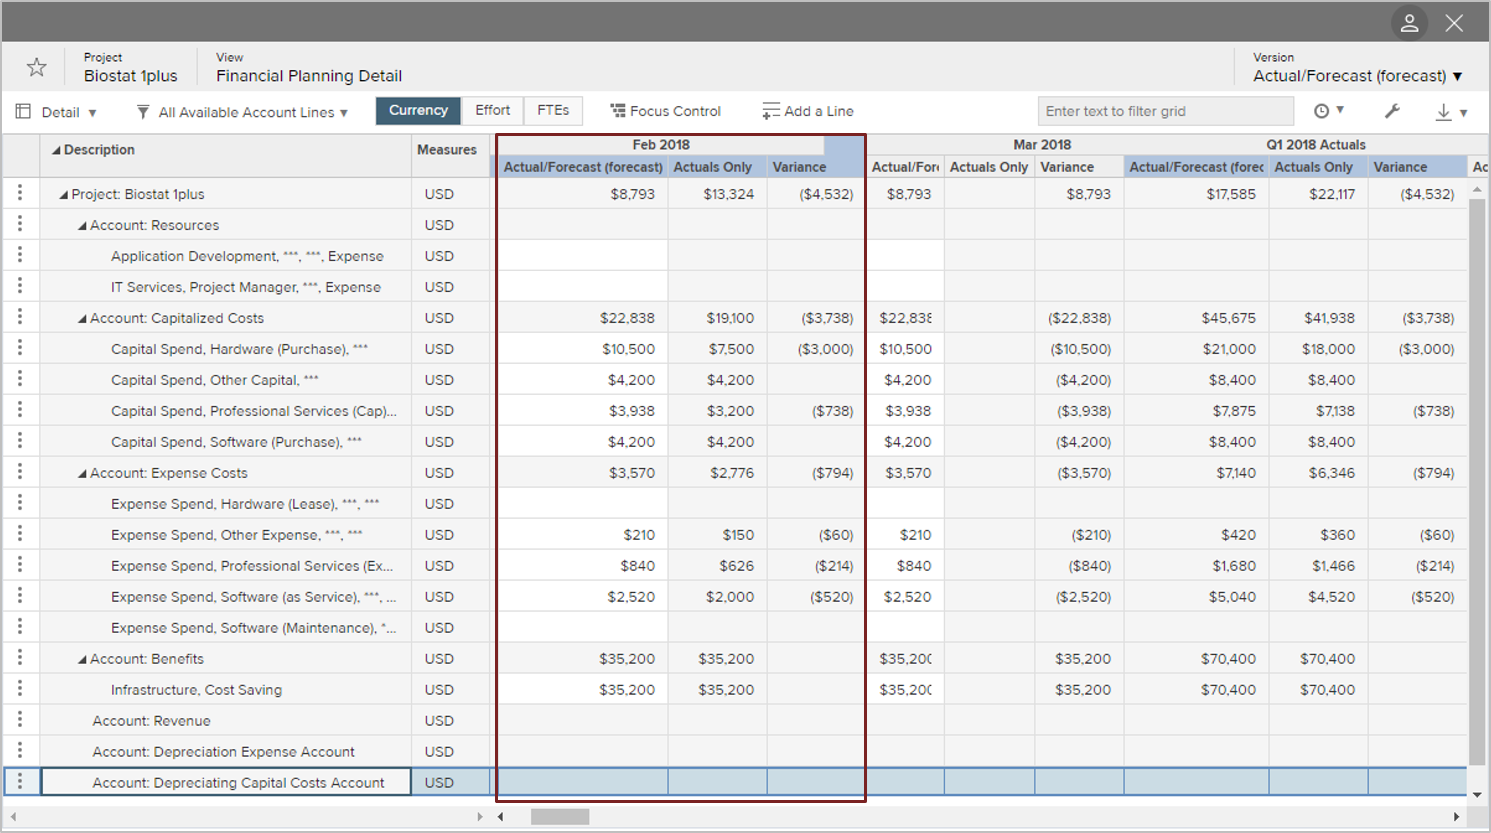
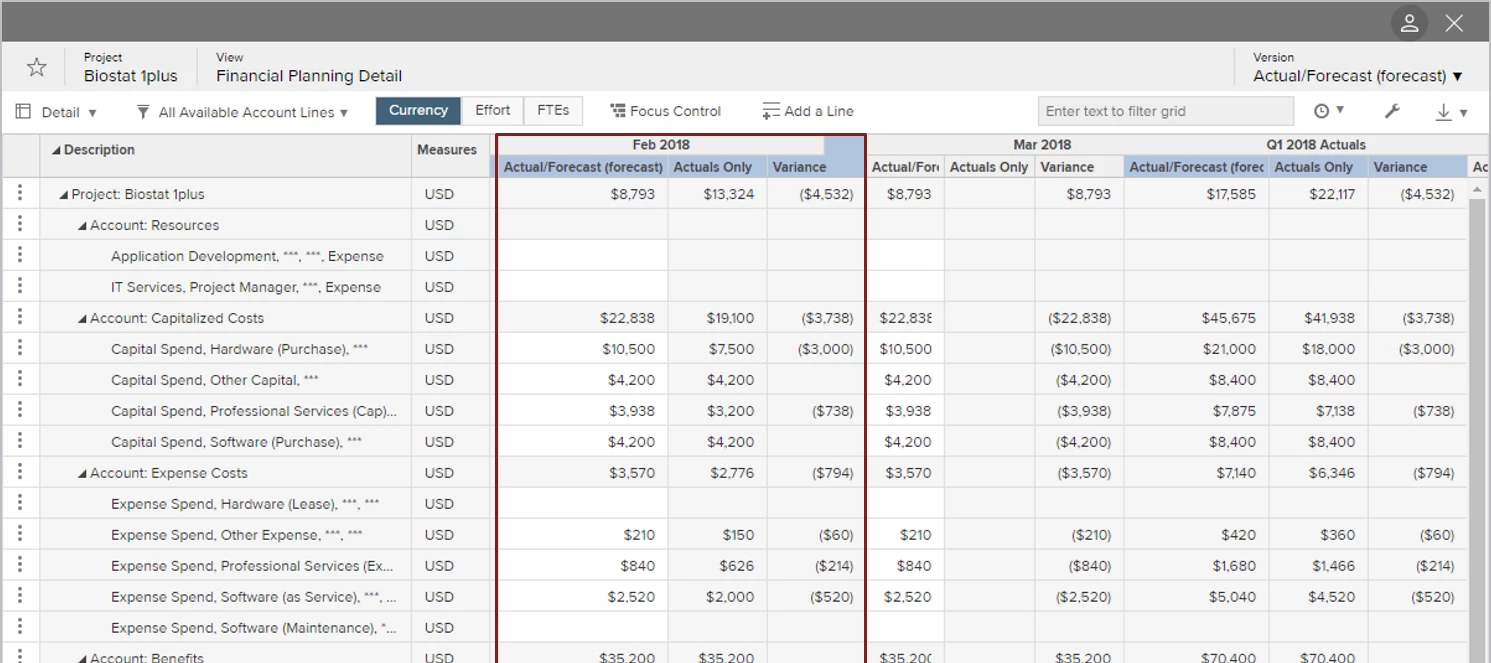
You might ponder, how do we distinguish between actual and forecast data within the current month? Though many financial managers tend to focus solely on end-of-month information and seldom delve into mid-month statistics, there's a solution. The optimal approach involves completing a financial load for a separate financial version, whether Actuals or Forecast. This supplements the combined Actuals/Forecast version, facilitating a clear differentiation between actual and forecasted figures for the current month.
{Figure 1}

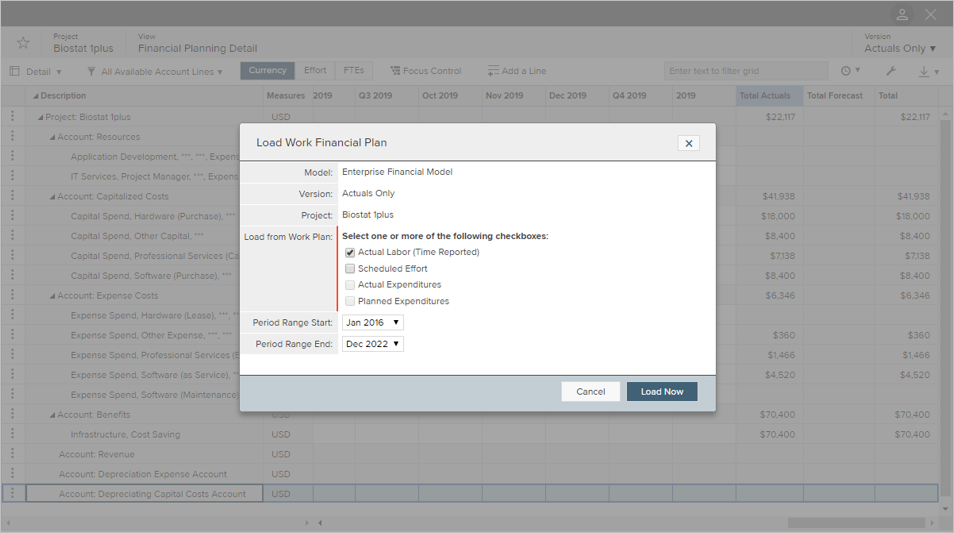
When completing a financial load {Figure 2} you have the option to load from either “Actual Labor (Time Reported)” and/or “Scheduled Effort.” Simply set up a financial load into a version named “Actuals,” only loading “Actual Labor (Time Reported).”
{Figure 2}

You can also complete a financial load into a version named “Scheduled,” only loading “Scheduled Effort” data. Alternatively this “scheduled” data can be achieved via a financial column that takes the desired “Actual/Scheduled” version data and subtracts the “Actual Labor” version data to get the “Scheduled Effort” version data.
These additional financial loads may be set up by the Administrator for all projects, or by individuals for specific projects only. New versions and column sets can only be created by the Administrator.
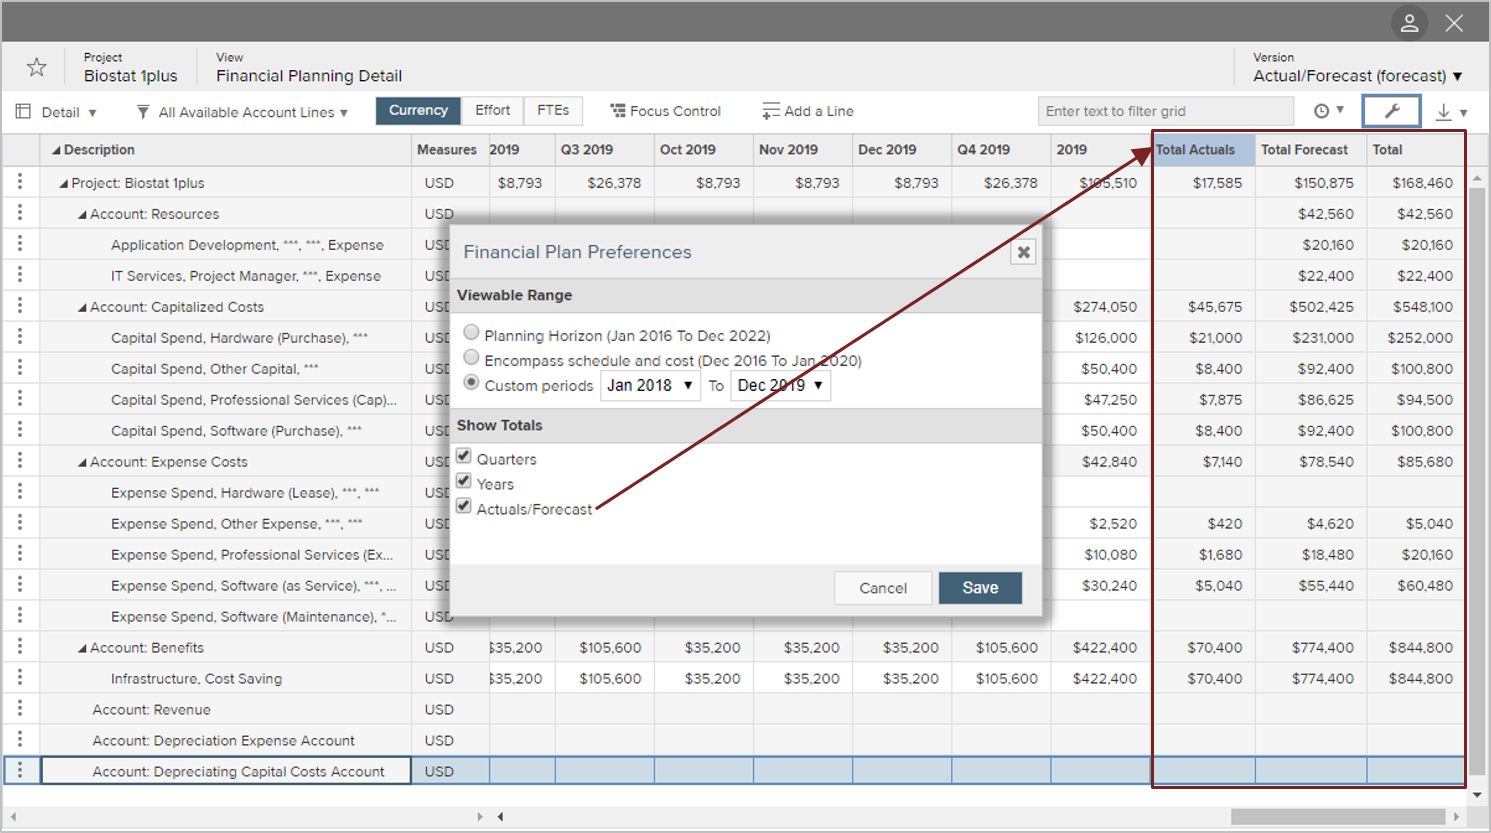
Individual preferences allow each user to "Show Totals" for Quarters, Years, or Actuals/Forecast (Figure 3). If Actuals/Forecast is selected, "Total Actuals" and "Total Forecast" columns display to the right of all viewable periods.
{Figure 3}


